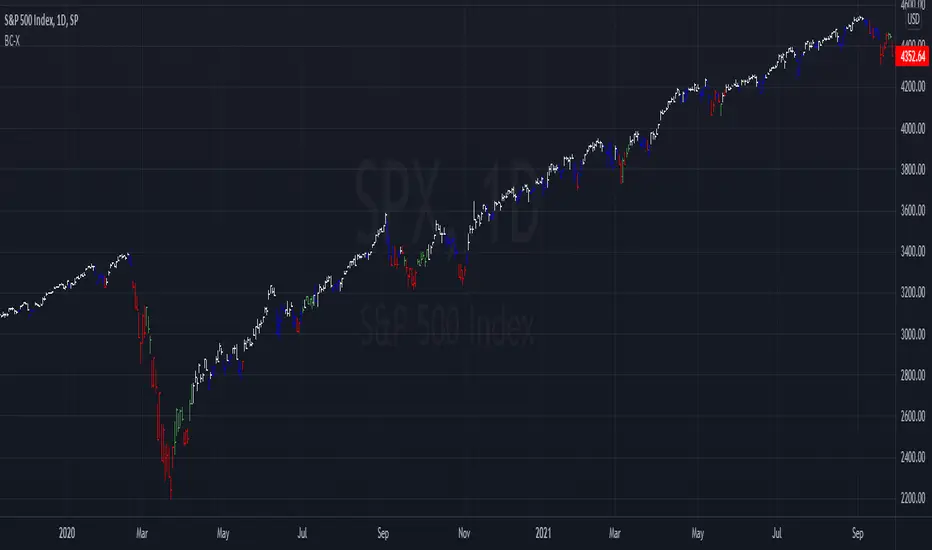
PriceScalperThis is a simple script that will visually show where buy and sell points occur based upon configurable price action. I wrote this purposefully to evaluate stablecoins and other narrow or fixed ranged markets where algorythms don't generally do well.
Putple triangles, pointing up, are buy signals.
Purple triangles, pointing down are sell signals
Alert conditions of BUY ASSET and SELL ASSET are provided for convience.
[i]price
R100 Volatility Combo Bands v1 (*v*)The Volatility Combo Bands are made from 4 separate volatility bands- two Bollinger Bands (10 and 20 period) and two Price Headley Acceleration Bands (10 and 20 period). The Volatility Combo Bands plot the innermost upper and lower points from these bands and then plots a mid-line. By default, only the standard 20 period Bollinger Bands and Combo Bands with mid-line are displayed, but can be configured however you want.
Try it out- see squeezes earlier, ride the bands earlier in trending markets, trade pullbacks to the Combo Bands and mid-line, trade the range of the band or use them to help identify potential support and resistance levels. Hopefully they can add another dimension to identifying volatility contraction patterns or whatever you currently use these things for!
I hope you get some value out of it. Only conditions of use are that if you improve it, let me know and if you publish something that uses it, don't hide the code! Enjoy!
Code for the Price Headley Acceleration Bands pinched and modified from LazyBear - thankyou.
Strategy based on the principles of Price ActionIt is considered the percentage of candles with low and high closure for a certain period. Then, a moving average is built from these values. When the moving average of the ratio of tall candles to low candles is greater than the ratio of low candles to high, then long (that is, when the green line crosses the red). And vice versa - a condition for short. It also works on crypto with other settings. Idea for improvement: you can make partial exit by taking, at certain profit levels, the chart will be more stable. Result with a commission of 0.004% You can create an optimizer, and use this strategy on any liquid asset. (Sorry for google translator)
Waves in Price (Volume Waves)Waves in Price (Volume Waves)
TheDowVolumeBigot>0 (Bullish) =Lime color
Very High=Dark Green color
High=Green color
TheDowVolumeBigot<0 (Bearish) =Orange color
Low=Red color
Very Low=Dark Red color
Barcolor
Forecast Oscillator & Point of ForceThis is a scaled version of the Forecast Oscillator, paired with a Point of Force Indicator, my modification of an indicator, whose original name and developer happened to be missing on my notes, so my regards to the author).
Point of force is a spot from where price action will dynamically evolve in the same direction or soon reverse and pursue that reversed path. It may be an indication of a turning point or entry point to consider going long/short and should be use together with a background oscillator showing a prevailing local trend.
Previous OHLC LevelsQuick dirty code for personal use. Plots previous OHLC levels based on a selected time-frame on the chart.
Not bad if you want to see different time-frame levels.
Fill function can serve to highlight the daily range (high-low or open-close) on non-standard charts
Uses base code from JayRogers
Price Percentage Divergence IndicatorThis is a price percentage divergence ( PPO ) indicator. It may as well be called a turning points indicator.)
Current Price Label by Westy_A simple Indicator to display the current price of the asset above the current bar. It shows a green label if the close is equal or greater than the open, red otherwise.
Current Price Bar LabelA simple Indicator to display the current price of the asset above the current bar. It shows a green label if the close is equal or greater than the open, red otherwise.
PriceDivergence (ps4)This script implements price divergence module using signals from several factors like:
RSI, RSI Stochastic, MACD, Volume MA, Accumulation/Distribution, Fisher Transform and CCI
Multi Horizontal Lines 540Draws horizontal lines depends on condition of regular price, if 10000 then increment is 540, otherwise increment by 54
IO_Volatility Quality Zero LineThis is the Volatility Quality Zero Line Indicator. This indicator measures volatility strength.
BossHouse - Price ChangeBossHouse - Price Change
What it is:
In the stock market, a price change is the difference in trading prices from one period to the next or the difference between the daily opening and closing prices of a share of stock.
Here you have a timeline with a bar price change. In seconds you can see if the selected market has good and high price changes or not.
The values are in percentage and you have a limiter in the settings, so you can show only bar/values above a value. Ex. 2.4%.
Why it Matters:
Price changes are a core component of financial analysis, and predicting price changes can be as, if not more, important than an actual price change.
It is important to remember, however, that percent-based price changes are useful only in the context of the number of dollars involved.
A 75% change in the price of a company X, for example, may only involve a few dollars while a 75% change in the price of company Y may involve thousands of dollars.
Settings:
Show the SMA 21 line
Minimum Limit - Set the minimum value to show a bar
Calculation:
For example, let's say Company XYZ shares opened at $25 this morning and closed at $24.
The price change is -$1, or -$1/$25 = -4%.
Any help and suggestions will be appreciated.
Marcos Issler @ Isslerman
Dynamic Price ChannelsThis indicator plots dynamic price channels based on the security highest close and lowest open.
The default is to display 8 core channels (with the option to plot the sub channel lines, off by default).
It’s simple really—this just divides the price action into equal channels. I’ve found this pattern helpful across all markets.
It’s dynamic because if a new high close or a new low close is created the all channels will adjust.
The key levels are 75% (blue), 50% (aqua), 25% (blue).
In between those key levels is a level separator.
The high close and the low open are both red.
These can all be customized in the settings.
What you’ll typically see at these channel boundaries are price slow downs, reversals, support and resistance.
Turning on sub-channels will provide further channel plots. On these sub-channels you’ll also see the same type of price action activity as mentioned above.
I’ve developed a trading system where this indicator helps identify key pivot areas. Combined with a few other indicators and key EMAs this trade system provides high probability trades around these key channel areas.
High/Low Breaker v2Specify Candles back to determine if high/low has been broken. Can choose to either calculate with source of high/low or close.
Seasonality-Buschi
English:
This script shows the price development over the last year (default: green) and mean prices over the last three (default: light green), six (default: orange) and nine (default: red) years and is therefore at least some kind of approach towards true seasonality.
Thanks to user "apozdnyakov" for providing most of the code!
Deutsch:
Dieses Skript zeigt den Kursverlauf über das letzte Jahr (Standard: grün) und die durchschnittlichen Verläufe über die letzten drei (Standard: hellgrün), sechs (Standard: orange) und neun (Standard: rot) Jahre und stellt damit zumindest eine Annäherung zu einer echten Saisonalität dar.
Dank an User "apozdnyakov", der den Großteil des Codes zur Verfügung gestellt hat!
Priceit plots
ema - you can choose length
it plots a custom price say x
it plots price x*factors >
1.0005* price
1.001* price
0.9995* price
0.999* price
1.002* price
1.004* price
1.006* price
1.008* price
1.010* price
1.012* price
you can edit these , the scrip is open source
it plots ohlc4 and ohlc4* factors
1.0005* ohlc4
1.001* ohlc4
0.9995* ohlc4
0.999* ohlc4
you can edit these , the scrip is open source
Multi-period Simple Moving Average trenderA plot of 6 SMA's grouped by 3's for short and long views of trading patterns.